Alpha Labs
Commissioned by a quantitative trading firm, Alpha Labs helps researchers and traders gather research, coordinate analysis and review computed results in one workspace. The public demonstration shows how repetitive research preparation and handovers can be organised, while strategy decisions stay with the team.
The commission focused on the work around quantitative research: gathering information, running analyses, investigating data problems and preparing findings for review. Alpha Labs brought AI-assisted coordination and computed results into a shared workspace so a researcher, trader or reviewer could pick up an investigation with its supporting context. The public examples demonstrate these workflows without exposing the client’s proprietary strategies.
Engagement: Commissioned by a quantitative trading firm
Focus: Research throughput, agent-assisted workflows and a shared review workspace
The mandate: help a quant team move research forward
Alpha Labs was commissioned by a quantitative trading firm to help its researchers and traders manage their workflows and increase throughput using AI agents. The useful unit of work was a research decision: a candidate investigated, an experiment reviewed, a data problem classified or a finding handed over with enough context for someone else to act on it.
This shaped the platform around the work surrounding quantitative analysis. Models could help coordinate tools and explain findings. Numerical research still needed computed results, explicit assumptions and a place for human review.
Alpha Labs is the public-facing demonstration of that work. The client's production setup, proprietary research and integrations with internal tooling remain under NDA. The examples here use public or demonstration inputs and describe the engineering approach without exposing the client's strategies or operating procedures.
Turning the mandate into a product
A researcher, a trader and a reviewer need different things from the same investigation. The product scope becomes much clearer when those needs are separated.
| User | Work to support | Useful output |
|---|---|---|
| Quantitative researcher | Investigate a hypothesis, run an experiment and examine competing explanations | Findings, configuration, computed results and open questions |
| Quantitative trader | Triage candidates and understand why a result deserves attention | A concise brief with supporting evidence and risk context |
| Research lead or reviewer | Challenge the result and decide what happens next | A reviewable record and an explicit approval or rejection decision |
| Research operations | Investigate missing data, failed jobs and unreliable model behavior | A task outcome, failure reason and enough context to retry or escalate |
The central design question was: what should an agent hand back so the next person can continue the work? A confident paragraph is insufficient. An experiment needs its configuration and results. A research brief needs competing findings. A data-quality task needs a concrete classification and supporting checks.
The public platform addresses these through a research pipeline, a specialist analysis layer, bounded agent workflows and a dashboard. They are distinct components with different responsibilities.
Separate numerical computation from agent coordination
The architecture places numerical work behind Python interfaces and exposes workflow progress and results through an API. The dashboard provides the human-facing workspace. Agent orchestration sits alongside these capabilities to request work, assemble context and produce structured outputs.
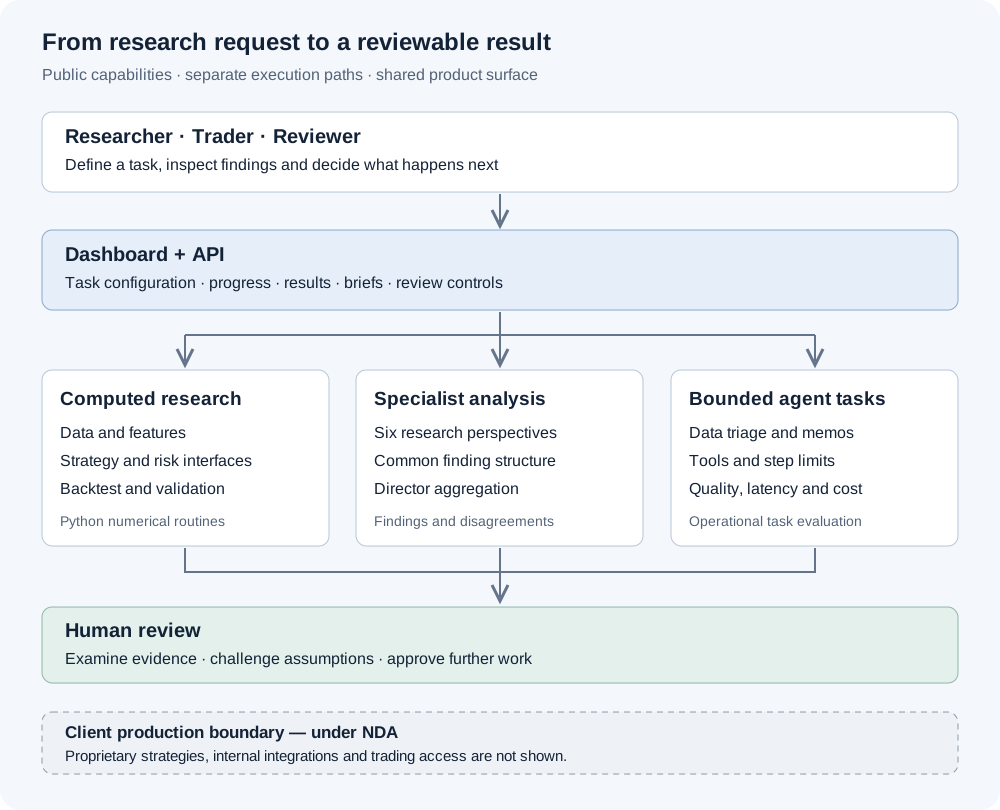
The diagram groups the public capabilities by responsibility. It does not expose the client's deployment topology or imply that every demonstration module runs in one continuous production pipeline.
The quantitative layer includes market-data connectors, feature calculation, registered strategies, risk assessment, backtesting, validation routines and signal-decay analysis. Polars and NumPy support the numerical transformations; DuckDB and Parquet support analytical data handling.
The agent layer has several execution styles. A research director gathers specialist findings. A LangGraph workflow represents research stages and an approval boundary. Separate, bounded tool-calling workflows evaluate model behavior on operational tasks. These are useful distinctions: a deterministic research pipeline, a panel of analytical specialists and an LLM choosing its next tool call solve different problems.
FastAPI connects these capabilities to a Next.js and React dashboard. TanStack Query manages server-facing data, Zustand manages client state, and Recharts and Three.js support complementary visual views. Containers provide a repeatable packaging boundary for the services.
Workflow one: investigate a candidate from several angles
The specialist layer implements six research perspectives:
| Specialist | Question it contributes to the investigation |
|---|---|
| Quantitative | What do computed features and strategy signals indicate? |
| Technical | What does price behavior suggest about trend and momentum? |
| Sentiment | What does the available text analysis contribute? |
| Fundamental | What do company financial measures suggest? |
| Macro | What broader regime or market context matters? |
| Contrarian | What weakens the apparent consensus? |
Each specialist returns a common finding structure, including a signal, confidence, reasoning and supporting detail. The director collects those findings and builds a combined view using deterministic aggregation. The public implementation runs this specialist pass sequentially and exposes progress as each component completes.
This modularity makes disagreement visible. Agreement among specialists is a useful navigation aid, but it is not an independent statistical test: several perspectives may depend on the same underlying prices or documents. A reviewer still needs to examine the evidence behind the combined view.
Consider a demonstration in which price momentum is positive but the macro assessment is cautious. The useful brief preserves both findings and the reason for the disagreement. The trader can then decide whether the candidate merits a deeper experiment, a smaller scope of investigation or no further work. That is more useful than reducing the entire investigation to a single persuasive recommendation.
Workflow two: move from an idea to an experiment record
The research pipeline provides a repeatable sequence: acquire data, select a strategy, compute features, generate signals, apply risk assessment, run a backtest and assemble validation and decay outputs. Momentum and mean-reversion strategies provide concrete public examples of the interface.
The dashboard exposes configuration, job progress and results so that a research task has a visible lifecycle. Equity curves, drawdowns and signal views help the reviewer inspect what happened. A conversational interface provides another way to explore research context; the underlying calculations remain separate from the conversation.
The important engineering boundary is between describing a result and establishing that the result is valid. An LLM can explain a drawdown already calculated by an engine. It cannot establish that the underlying prices were available at the time, that the signal could have been executed at the assumed price or that a selected strategy survived a fair out-of-sample test.
For a credible research workflow, the review questions therefore remain explicit:
- Which data snapshot and universe were used, and what was known at the decision time?
- When was the signal formed, and when could the position actually change?
- Which costs, liquidity assumptions and position constraints apply?
- How many variants were tried before this result was selected?
- What changed between this experiment and the previous one?
These questions define the standard for reviewing the computation. A generated explanation is an additional view of the evidence, not the evidence itself.
Workflow three: evaluate agents on bounded quant operations
The project also contains a model-comparison harness for two narrow operational tasks: market-data triage and signal-validation memos. These are tractable tasks for testing whether an agent can use tools correctly and produce a usable structured result.
In the data-triage workflow, an agent inspects supplied market-data information, requests relevant checks and submits a classification. In the memo workflow, it retrieves a signal and its backtest summary before submitting a decision with cited numerical fields. The surrounding workflow supplies tools, tracks calls and limits the number of steps.
The evaluation design includes repeated examples, tool-use checks, output grading, token usage, latency and estimated cost. It separates several questions that otherwise become blurred: did the task finish, did the model retrieve the required information, did the submitted fields agree with the supplied artifact, and how much did the attempt cost?
This is a useful model-selection surface because it resembles a unit of work an operations team can inspect. Its scores describe performance on those bounded tasks. They do not establish investment performance or validate the strategy that produced a backtest.
There is also a practical test before introducing a model: if a decision follows entirely from explicit numerical rules, ordinary code may be the right implementation. The agent earns its place when it handles variable context, interprets a request or coordinates the steps around that computation.
The dashboard is part of the research workflow
A backend that produces an analysis is only part of the product. The researcher needs to know whether a job is still running, which result belongs to which configuration and what requires attention. The trader needs a concise view without losing access to the details. The reviewer needs to inspect a result before agreeing with it.
The dashboard brings together research briefs, experiment results, specialist status, signals and conversational interaction. Two-dimensional charts support familiar inspection of returns and drawdowns. Three-dimensional views provide additional ways to explore correlation or volatility structure where that representation is useful.
Visualizations are there to help someone ask a better question. A polished equity curve does not establish a trustworthy backtest, and a composite confidence score should not conceal disagreement between specialists. The review surface needs to keep the underlying findings accessible.
Where the difficult engineering decisions sit
Breadth versus coherence. A useful quant workspace touches data, statistical research, agents and operations. Modular components make that breadth manageable, but the handoff between components matters as much as the components themselves. A result should carry its configuration and provenance into the next stage.
Interactive work versus long-running work. A user exploring a ticker expects a responsive interface; a broader experiment can take substantially longer. Progress reporting and job-oriented execution help separate those experiences. Recovery, cancellation and durable state are important production acceptance criteria whenever work can outlive an API request.
Agent flexibility versus reproducibility. Tool selection gives a model flexibility, while bounded steps and structured outputs make its behavior inspectable. Reproducibility additionally requires retaining the inputs, model configuration, tool results and versions associated with a run.
Research breadth versus execution authority. Candidate analysis, experiment review and paper simulation are useful public demonstrations. The client's execution access and trading controls belong to its internal systems. The public showcase stops at the research and review boundary.
Measuring the value in the right units
The commercial objective was higher team throughput. The most informative measurement is how much useful work reaches review and completion, including the human effort needed to correct it.
| Measurement | What it would establish |
|---|---|
| Accepted research tasks per researcher-week | Whether the team completes more usable work |
| Median and tail time from request to review-ready result | Whether the workflow becomes more predictable |
| Human correction time per result | Whether automation reduces effort or merely moves it |
| Repeated or abandoned experiments | Whether configuration and evidence are easier to recover |
| Cost per accepted task, including failed attempts | Whether the workflow is economical at the required quality |
These are the appropriate measures for this engagement's objective. The public case study does not attach a numerical productivity gain or trading-return claim to the demonstration.
The visible engineering outcome is a set of connected research capabilities, a review workspace and a bounded evaluation harness. Together, they show how an open-ended request to “use AI for quant research” can be made concrete: define the task, expose the computation, retain the findings and make the next decision easier to review.
Contribution
My contribution covered architecture and hands-on development across the Python research backend, agent workflows and research dashboard. The work connected the client's throughput objective to concrete research tasks, computational interfaces and a human review experience, while keeping the publicly shareable demonstration separate from the client's production environment and internal tooling.
Technical Stack
| Layer | Technology |
|---|---|
| Research | Python, Polars, NumPy, SciPy, DuckDB, Parquet |
| Agent workflows | LangGraph, LiteLLM, Structured tool calls |
| Backend | FastAPI, Pydantic, SQLAlchemy |
| Dashboard | Next.js, React, TanStack Query, Zustand, Recharts, Three.js |
| Packaging | Docker |
How engagements like this are scoped and delivered: How I Work.